Performance Testing
Overview
Mobile device fragmentation creates unique challenges for app performance. Users access your application on devices with:
Varying hardware configurations - Different CPU, memory, and storage capabilities
Multiple Android versions - Wide range of OS versions and manufacturer customizations
Diverse screen sizes and resolutions - From compact phones to large tablets
Different network conditions - 3G, 4G, WiFi, and varying connection speeds
Performance-First Approach
RobusTest adopts a performance-first methodology for mobile app testing. This means that during both manual testing sessions and automated test runs, comprehensive performance metrics are available at your fingertips.
Key Performance Benefits:
Real-time Monitoring: Track performance metrics as you test
Historical Analysis: Compare performance across different app versions
Device-Specific Insights: Understand how your app performs on various devices
Bottleneck Identification: Quickly identify performance issues before they impact users
Performance Monitoring During Testing
Manual Testing Performance Monitoring
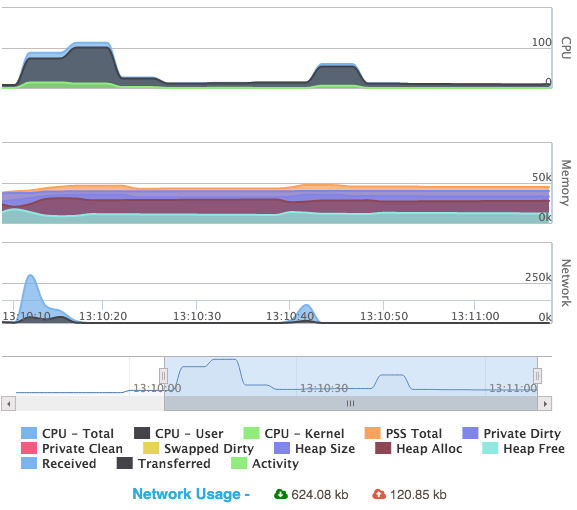
During manual testing sessions, you can monitor comprehensive performance metrics in real-time. The performance monitoring panel provides instant visibility into your app’s resource consumption.
Available Performance Metrics:
Memory Usage Monitoring
Track critical memory usage parameters including:
Heap Memory: Monitor allocated and used heap memory
Native Memory: Track native memory consumption
Graphics Memory: Monitor graphics-related memory usage
Memory Leaks: Identify potential memory leak patterns
Note
For detailed explanations of Android memory metrics, refer to the Android Developer Documentation on Memory Management.
CPU Usage Monitoring
Monitor your application’s CPU consumption with detailed insights:
Total CPU Usage: Track overall CPU utilization
Per-Core Usage: Monitor usage across individual CPU cores
Process-Specific Usage: Isolate your app’s CPU consumption
Tip
Understanding CPU Usage Over 100%: On multi-core processors, CPU usage can exceed 100% when your app utilizes multiple cores simultaneously. However, sustained high usage may indicate performance optimization opportunities.
Network Usage Monitoring
Monitor your app’s network activity comprehensively:
Real-time Data Exchange: Track live upload and download rates
Cumulative Session Data: Monitor total data consumption for the entire test session
Network Request Analysis: Analyze individual network requests and responses
Bandwidth Utilization: Monitor how efficiently your app uses available bandwidth
⚠️ Network Performance Impact
User Experience Considerations: High network usage significantly impacts user experience, especially on slower connections or limited data plans. Monitor not just the quantity of data transfer, but also the efficiency and necessity of each network operation.
Optimization Strategy: Focus on reducing unnecessary network calls, implementing intelligent caching, and optimizing data transfer sizes to improve both performance and user satisfaction.
🎯 Performance Testing Best Practices
Comprehensive Performance Strategy:
📱 Device Diversity: Test across different device performance tiers
🌐 Network Conditions: Validate performance under various network speeds
⏱️ Real-world Scenarios: Test performance during typical user workflows
📊 Baseline Establishment: Create performance baselines for regression detection
🔄 Continuous Monitoring: Integrate performance testing into CI/CD pipelines
See also
Related Documentation:
Manual Testing - Manual testing with performance monitoring
Live View - Real-time performance monitoring during testing
Automation Reports - Performance data in automation reports
Health Page - System and device health monitoring